Ethics in Data Visualization
How we visualize climate data can significantly impact public understanding and policy decisions. Ethical visualization practices ensure that data is presented accurately and fairly, while misleading visualizations can distort perceptions and hinder effective action.
Ethical Data Visualization
Example: Dual-Axis Comparison of Power Usage vs Whitespace
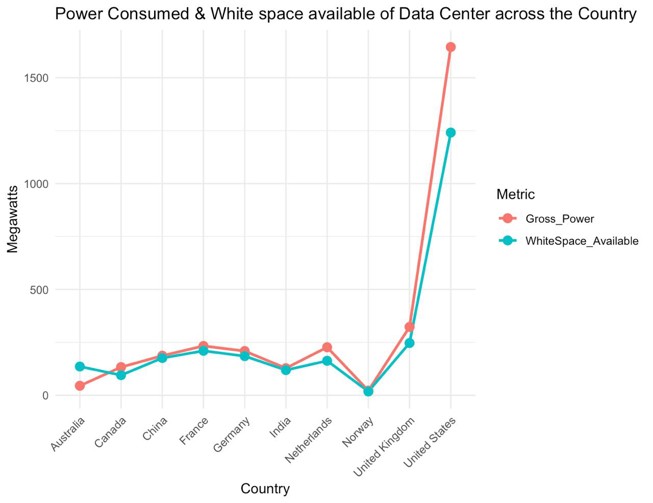
Source: Devastator, Kaggle (2025), "Global Data Centre Energy Footprints"
What Makes This Ethical:
- Clearly labeled axes with appropriate scales
- Distinct colors with good contrast for accessibility
- Includes zero baseline for proper context
- Transparent methodology and data sources
Impact on Understanding:
This visualization accurately shows the relationship between power usage and efficiency improvements. By using dual axes with appropriate scales, it allows viewers to see both absolute values and relative changes without distortion.
The clear presentation helps policymakers and the public make informed decisions based on accurate data representation.
Misleading Data Visualization
Example: Misleading Bar Graph Focusing Only on Power Use
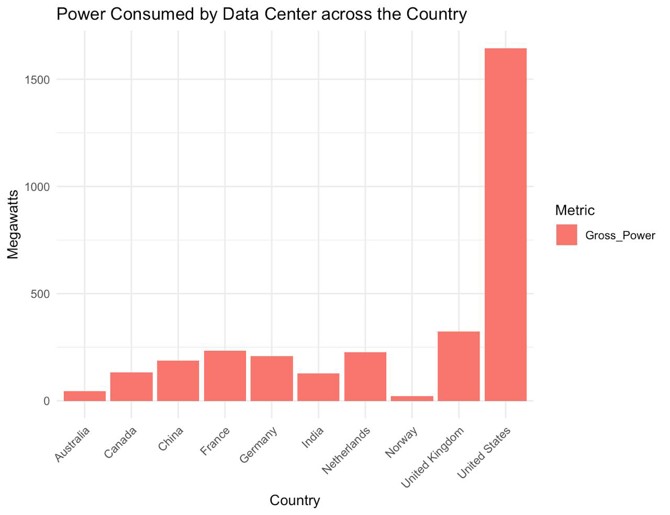
Example of misleading visualization
What Makes This Misleading:
- Truncated y-axis that doesn't start at zero
- Cherry-picked time periods that hide long-term trends
- Misleading title that makes claims beyond the data
- Missing or vague information about data sources
Impact on Understanding:
This visualization artificially exaggerates small changes by manipulating the y-axis scale. It creates a visual impression of dramatic change when the actual percentage difference might be minimal.
Such misleading presentations can lead to misallocation of resources, inappropriate policy responses, or public confusion about the true nature of climate trends.
Guidelines to Create Ethical Charts
Technical Considerations
- Appropriate Scales: Use scales that accurately represent the data without distortion.
- Complete Data: Show the full context of the data, including historical trends when relevant.
- Avoid Emotional Colors: Use neutral color schemes that don't bias interpretation.
- Accessibility: Design visualizations that are perceivable by people with various visual abilities.
Ethical Responsibilities
- Transparency: Clearly document data sources, methodologies, and any manipulations.
- Objectivity: Present data fairly without cherry-picking to support predetermined narratives.
- Context: Provide sufficient background information for proper interpretation.
- Responsibility: Consider the potential impact of visualizations on public understanding and policy.